- Anatomy of a Sheet Worker
- Variables – How to Name Things
- Arithmetic in Sheet Workers
- What If? in Sheet Workers
- Arrays and Dropdowns
- JavaScript Objects
- Getting Loopy With JavaScript
- Strings in Sheet Workers
- Logging in the Browser Console
- Strings, Arrays, and Loops
- Undefined and Other Error Values
- Asynchronicity and Things to Avoid With Loops
- Events, and watching Attributes
- Changes and the eventInfo Object
- Action Buttons
- setAttrs and Saving Attributes
- The Ternary Operator – The One-Line If
- Template Literals
- Functions and the Fat Arrow
- A Sheet Worker Reprise
- Castle Falkenstein Design – Sheet Workers
- The Perils of Sheet Worker Functions
- The Script Block and Identifying Characters
When you create a character sheet on Roll20, you are working in the browser, or maybe you write the sheet in a Programming Editor like Visual Studio Code and run the sheet in the Sandbox. Either way, you see the fruits of your labour in the browser, and that makes it hard to see what is going on in the code itself. If there’s an error, often the code just doesn’t run and you are left scratching your head wondering what happened.
This is where the browser console comes in. You can use it to find out what is going on. (For those who have written many sheet workers before, pay attention: you might encounter a lot of stuff you haven’t seen before.)
Finding The Browser Console
The Console is not usually visible. Whether in Chrome or Firefox, press the F12 key on your keyboard. A sidebar (maybe at the bottom in Chrome) like the one below will appear. See those tabs: Inspector, Console, Debugger, and maybe more. Click the Console one, and that’s it, you’re in the console.
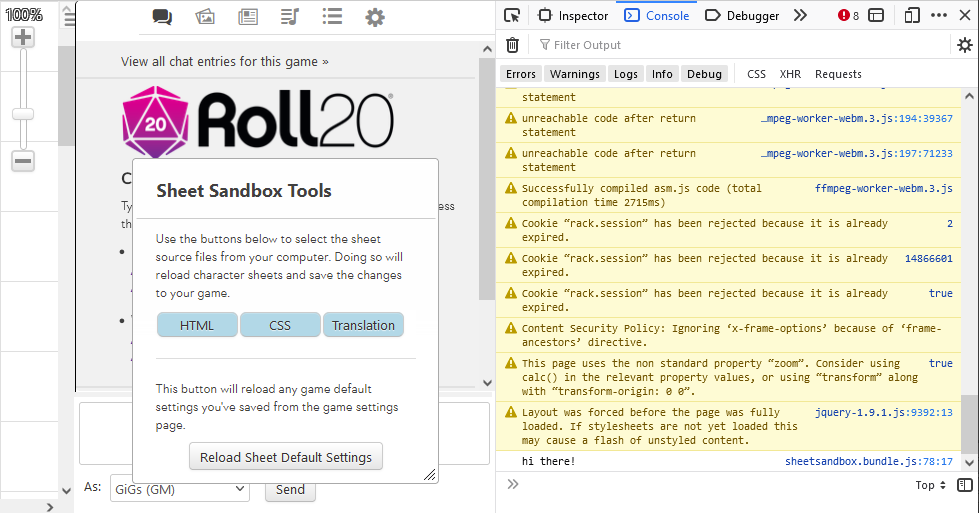
It looks confusing, but don’t be put off. Also, there’ll be a lot of entries in the console, but you can ignore them all. These are messages created by the browser for software engineers – they relate to the browser itself, not to your character sheet – so they are irrelevant to you. Part of the skill in using the console is finding the code you have put in there, and ignoring everything else.
You can see a hi there! message I’ve created right at the bottom. To make that appear, I added this to a sheet worker:
console.log("hi there!");Code language: JavaScript (javascript)That’s it – anything you put inside the brackets is printed to the console. You can enter any variable type – using quotes here means it’s a String.
Now we’ll talk about how to use that to figure out your own sheet workers, and to analyse errors.
Printing To The Console
There are two main reasons you might use logging.
The first is, simply enough, so you can see what is happening. For example:
on('change:version', function({
   getAttrs(['version', 'character_name'], function(values) {
      console.log("The version attribute for ' + values.character_name + ' just changed.");
      // rest of codeCode language: JavaScript (javascript)
Some people use logging as a kind of progress report. You can see what is happening under the hood.
Another use, which we’ll focus on here, is to find out where errors occur and to learn about the error. The problem is, the sheet worker script blog is isolated from the rest of the sheet. If it fails, it might fail silently and your only clue a failure has happened is that one or more sheet workers stop working.
It can be hard to figure out why. That’s where logging comes in.
When one or more sheet workers stop working, you have to figure out where the problem is. It’s possible that an error in one sheet worker stops everything working in that worker after the error occurs. It’s also possible that an error in one worker causes all workers to stop working. It’s also possible an error in the event line (that starts on() means the sheet worker never starts!
So the first thing to do here is to find out where the error is. You can do this by adding cosole.log statements in your code, everywhere you think there might be an error. For example:
on('change:attribute', function({
   console.log('attribute worker started');
   getAttrs(['attribute'], function(values) {
      console.log('attribute worker: getAttrs');
      const att = +values.attribute || 0;
      console.log('attribute values = ' + att);
// and so on.Code language: JavaScript (javascript)
With methods like this, you can figure out where the problem is. JS will run console.log statements up to an error, and none after the error, so the error can be found in your code before the first console.log that doesn’t run.
As shown in the previous tab, you can log specific values of variables and attributes. Sometimes when an attribute has a value you don’t expect, that can cause your problem.
Using string concatenation, you can combine strings – your label and the desired value.
      const att = +values.attribute || 0;
      console.log('attribute values = ' + att);Code language: JavaScript (javascript)
Or if you know what you are looking for you can just include the attribute. These can be hard to spot in the browser console (but there is some help here – see below);
      const att = +values.attribute || 0;
      console.log(att);Code language: JavaScript (javascript)
You can print several attributes at the same time, and even multiple values. Separate each with a comma. And you can print arrays and objects and any other data type.
      console.log(att, "this is another stat: " + another_stat);
      const my_array = [1, 2, 3];
      console.log('my array is: ' + my_array);Code language: JavaScript (javascript)
One thing that is really handy, is you can print out a variable and its value, just by listing its variable name inside curly brackets (making it an object). For example:
const stat1 = 'first value';
const stat2 = 'second value';
const stat3 = 'third value';
console.log({stat1, stat2, stat3});Code language: JavaScript (javascript)
This looks like this, and (second pic) with the dropdown button clicked:


Being able to enter variables in groups in this way is very handy, or at least saves a lot of typing!
Finding your console Statements
I don’t see the things mentioned here used in other character sheets, so even if you are an old hand at sheet authoring, you might want to check this out. Newbies, you can get a leg up on the old-timers here.
The description above tells you how to use console.log, which is great for examining what is going on in your worker. There are a lot of ways you can make your console statements easier to find. Here’s a quick overview of the most useful things you can do.
The browser console is often full of entries that are useless for you and make it harder for you to find the information you want. See the image to the right and imagine scrolling through pages and pages to find one console.log statement. But you can do this:

You can completely empty the console with this simple command:
console.clear();Code language: JavaScript (javascript)You can enter it in a worker, but if you want maximum control over when it’s triggered, it’s better to type it directly in the console.

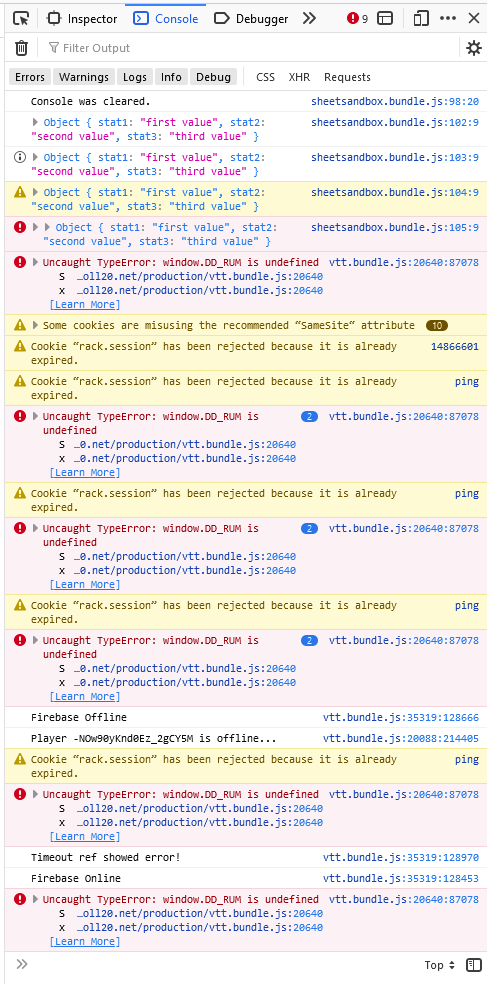
In additon to console.log, you can use console.info, console.warn, and console.error. These work exactly like console.log, but are printed out to the console with some styling applied- they look different and might be easier to spot (also you might use error or warn for things you think might be iffy and want to draw attention to them). They look like this:
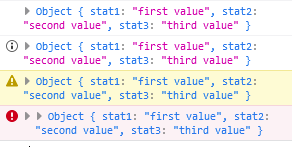
Note that they each place a symbol in the sidebar, error is shaded yellow, and error is shaded red.
This makes it easier to spot when browsing the long list of useless browser statements. I tend to use info for everything – that i in the sidebar is easy to spot.
There’s also console.debug, but as far as I can tell, it looks the same on Roll20 as console.log, so there’s no need to use it.
You aren’t limited to using the inbuilt styles. You can apply lots of styling information, but how you do it is a bit counterintuitive.
console.log("This is standard text. %cThis is blue.%cThis is green.","color:blue","color:green");Code language: JavaScript (javascript)Basically, each %c in your log statement will not be printed, but is a marker saying, “start a class here.” Then at the end of your log declarations, include each class. Put them after any variables or text.
You can do more than just change the colour of text. Try every style you want:

console.log("This is standard text. %cThis is bordered.%c This is green.","color:blue; border: 1pt solid black;","color:green");Code language: JavaScript (javascript)The %c won’t be printed, but the style starts at that point. If you want to print out multiple values, combine them into a single string.
console.log("att1 = " + att1 + ";%catt2 =" + att2, "color:blue; border: 1pt solid black;");Code language: JavaScript (javascript)When you have a bunch of separate statements but want to show them together in the console, you can group them. This creates a natural block of statements that you can open and collapse – they stand out and are easily found, and you can label the group.
const stat1 = "test";
const stat2 = "another test";
const stat3 = "final test";

console.group('Test Group');
console.log('log: ' + stat1);
console.log('log: ' + stat2);
console.log('log: ' + stat3);
console.info('info: ' + stat1);
console.warn('warn: ' + stat2);
console.error('error: ' + stat3);
console.groupEnd();Code language: JavaScript (javascript)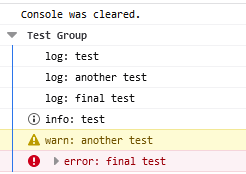
The group label is optional. And the group starts out expanded by default, but you can make it start collapsed. by using groupCollapsed() instead of group().
console.group();
console.log('log: ' + stat1);Code language: JavaScript (javascript)console.groupCollapsed();
console.log('log: ' + stat1);Code language: JavaScript (javascript)Groups are a great way to make a, ahem, group of log statements stand out.
You can print your log statements as a formatted table. This should be used when you have an array or object to print and you want it nicely formatted.
const weapons = {
   sword: {attack: 1, Damage: "1d6+1", strength: 13},
   greatsword: {attack: 1, Damage: "2d6", strength: 17},
   hammer: {attack: 0, Damage: "1d6+1", strength: 10},
}
console.table(weapons);
console.table(weapons, ['Damage']);Code language: JavaScript (javascript)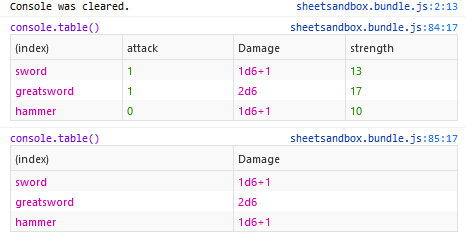
As shown here you can print the enter array or object, and it will be given row titles and headings. And for objects, you can print a specific column, by enclosing the name of that column in [ ], and treating it as a string (which must therefore be spelt accurately).
The final tip we’ll cover here is how to make conditional logs. In javascript, everything is either truthy (it exists, and is kind true), or falsy (empty statements and errors). So you can do this:
let show_log = 0;
console.assert(show_log, "Show this.");
let dont_show_log = 1;
console.assert(dont_show_log, "Don't show this.");
Code language: JavaScript (javascript)
That looks like this in the browser console: ![]()
When creating a conditional log, use console.assert(value_to_evaluate,”test to show”);
If the value to evaluate is truthy the log won’t be printed, and if false it will be. So you can build a worker that shows errors only when values aren’t as they should be.
While this is neat, it probably isn’t very useful in the context of Roll20. You don’t control the output message and can’t apply your own styles. But it’s neat enough to show.
Wrapping Up
There you have it. There are lots of ways to use the console, including a few more than listed here, but I think these are the most useful for Roll20. I haven’t covered making your own logging function – maybe I’ll post that later. Have fun making your browser console more useful 🙂
